Houseplant statistics and gardening trends: what 131k photo identifications reveal about plant care
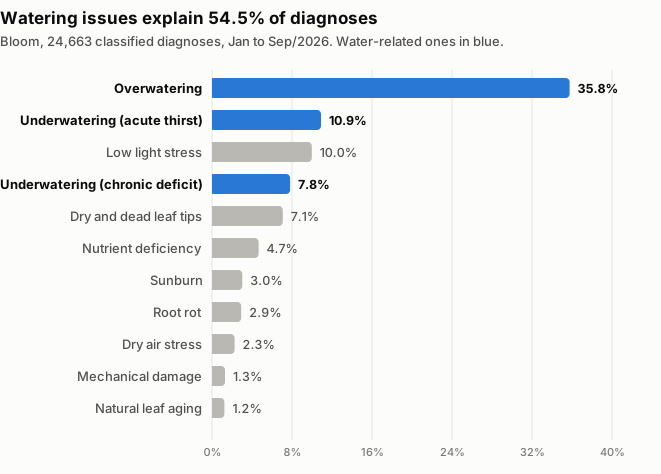
We compiled data from 131,502 photo-based plant identifications and 25,875 diagnoses made on Bloom between January and September 2026. Overwatering is the most common issue, accounting for 35.8% of diagnoses.

Between January 20 and September 23, 2026, people speaking 20 different languages pointed their cameras at a plant and asked Bloom for help 131,502 times. In 40.51% of those photos, there was some sign of trouble. Among the diagnosed issues, the most common was overwatering, accounting for 35.8% of cases.
This page compiles what those numbers show. All proprietary data comes from aggregated queries of the app's database, containing no individual user information, and is presented alongside its sample size. Public data is provided with a link to the original source. These houseplant statistics offer an open, data-driven look into how we care for our indoor gardens.
Quick summary:
Overwatering accounts for 35.8% of all sick plant diagnoses (8,819 out of 24,663).
Combining this with the two underwatering diagnoses, watering issues explain 54.5% of all problems.
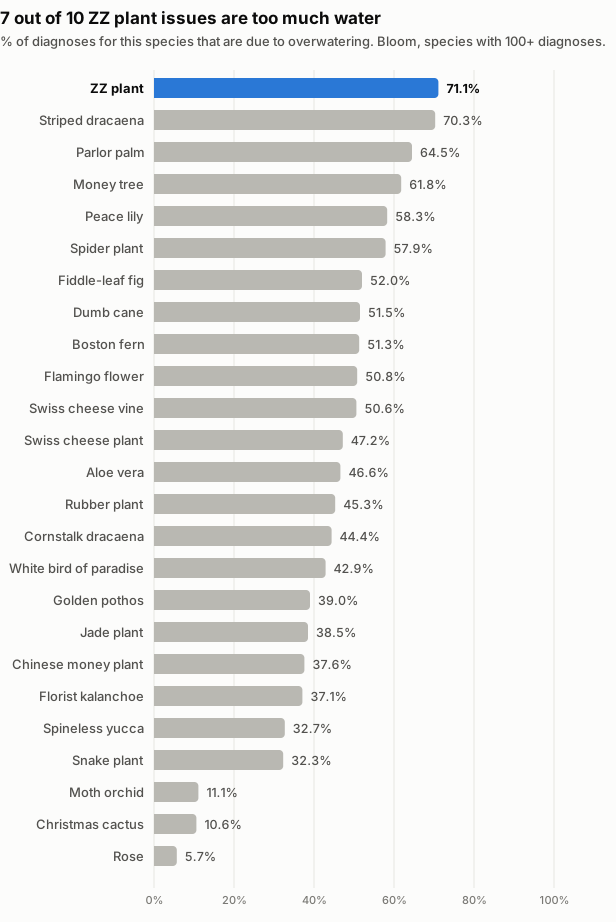
The ZZ plant, often marketed as indestructible, is the most frequently drowned: 71.1% of its diagnoses are due to overwatering.
3.85% of the photos submitted for plant identification did not actually contain a plant.
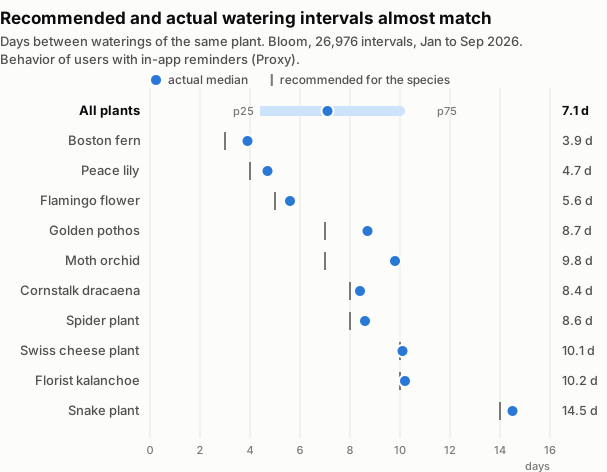
Users with reminders water every 7.1 days on median, with a delay of only 0.38 days past their species' recommended interval.
Updated on September 24, 2026. You are welcome to cite any statistic on this page, with attribution to Bloom and a link back to this article.
Headline numbers
Metric | What it is | Sample size | Label | Source |
|---|---|---|---|---|
131,502 | photo-based plant identifications | full window | Measure | Bloom, Jan to Sep/2026 |
40.51% | of identifications showed signs of a health issue | n = 131,502 | Measure | Bloom, Jan to Sep/2026 |
3.85% | of submitted photos did not contain a plant | n = 131,502 | Measure | Bloom, Jan to Sep/2026 |
37.15% | of identifications were added to a virtual garden | n = 131,502 | Measure | Bloom, Jan to Sep/2026 |
25,875 | health issue diagnoses | full window | Measure | Bloom, Jan to Sep/2026 |
375,433 | care reminders generated | full window | Measure | Bloom, Jan to Sep/2026 |
$79.0 B | spent on gardening in the United States in 2025, up 13.5% | US households | Measure by third party |
The most common mistake with plants is overwatering
Two American universities have been saying this for years, though without specific numbers. The University of Connecticut Home & Garden Education Center writes that "inconsistent watering is perhaps the number one cause of a houseplant's demise" (regar de forma inconsistente é talvez a causa número um da morte de uma planta de casa). The Iowa State University Extension is even more direct: "overwatering is a common reason houseplants fail" (o excesso de água é um motivo comum de fracasso com plantas de casa).
Bloom's 25,875 diagnoses put concrete numbers behind these statements.
Diagnosed issue | Diagnoses | % of total |
|---|---|---|
Overwatering | 8,819 | 35.76% |
Underwatering (acute thirst) | 2,688 | 10.90% |
Low light stress | 2,462 | 9.98% |
Underwatering (chronic deficit) | 1,926 | 7.81% |
Dry and dead leaf tips | 1,745 | 7.08% |
Nutrient deficiency | 1,150 | 4.66% |
Sunburn | 748 | 3.03% |
Root rot | 721 | 2.92% |
Dry air stress | 557 | 2.26% |
Mechanical damage | 321 | 1.30% |
Natural leaf aging | 305 | 1.24% |
Source: aggregated Bloom data, 24,663 diagnoses with a classified disease (out of 25,875 in total) between 20/01 and 23/09/2026. Measure. Minimum threshold of 20 cases per row.
Watering accounts for 54.5% of all diagnoses, with overwatering occurring nearly twice as often as underwatering.
Overwatering leads in every month, but its share fluctuates. In August 2026, it accounted for 40.0% of diagnoses, and underwatering for 18.6%. In September, up to the 23rd, the figures were 34.0% and 18.8%. Underwatering remained flat; low light stress was what gained ground. These two months combined represent 22,274 diagnoses.
The plants most likely to be drowned
Overwatering is not distributed equally. For some species, it explains seven out of ten problems, while for others, almost none.
Species | Diagnoses | % due to overwatering |
|---|---|---|
ZZ plant (Zamioculcas zamiifolia) | 308 | 71.1% |
Striped dracaena (Dracaena reflexa) | 172 | 70.3% |
Parlor palm (Chamaedorea elegans) | 242 | 64.5% |
Money tree (Pachira aquatica) | 178 | 61.8% |
Peace lily (Spathiphyllum wallisii) | 713 | 58.3% |
Spider plant (Chlorophytum comosum) | 347 | 57.9% |
Fiddle-leaf fig (Ficus lyrata) | 100 | 52.0% |
Dumb cane (Dieffenbachia seguine) | 163 | 51.5% |
Boston fern (Nephrolepis exaltata) | 152 | 51.3% |
Flamingo flower (Anthurium andraeanum) | 256 | 50.8% |
Swiss cheese vine (Monstera adansonii) | 160 | 50.6% |
Swiss cheese plant (Monstera deliciosa) | 513 | 47.2% |
Aloe vera (Aloe vera) | 247 | 46.6% |
Rubber plant (Ficus elastica) | 117 | 45.3% |
Cornstalk dracaena (Dracaena fragrans) | 385 | 44.4% |
White bird of paradise (Strelitzia nicolai) | 140 | 42.9% |
Golden pothos (Epipremnum aureum) | 421 | 39.0% |
Jade plant (Crassula ovata) | 221 | 38.5% |
Chinese money plant (Pilea peperomioides) | 109 | 37.6% |
Florist kalanchoe (Kalanchoe blossfeldiana) | 264 | 37.1% |
Spineless yucca (Yucca gigantea) | 113 | 32.7% |
Snake plant (Dracaena trifasciata) | 359 | 32.3% |
Moth orchid (Phalaenopsis) | 642 | 11.1% |
Christmas cactus (Schlumbergera truncata) | 132 | 10.6% |
Rose (Rosa) | 141 | 5.7% |
Source: aggregated Bloom data, diagnoses with a classified disease, Jan to Sep/2026. Measure. Only species with 100 or more diagnoses are included.
The ZZ plant is widely marketed as a beginner friendly plant that can survive any level of neglect. It stores water in underground rhizomes, which makes it highly drought tolerant but also extremely sensitive to waterlogged soil. Drawn in by its indestructible reputation, owners often water it far too frequently, leading to overwatering in 7 out of 10 diagnosed cases.
Aloe vera and the jade plant tell a similar story in succulent form. At the bottom of the table are the moth orchid, Christmas cactus, and rose, at 11% or less: their problems lie elsewhere. Among indoor foliage plants, the snake plant has the lowest percentage, at 32.3%, and the explanation lies in its interval: watering every 14 days is spaced out enough that it is difficult to overdo it.
The most frequently identified plants
# | Plant | Botanical name | Identifications | % |
|---|---|---|---|---|
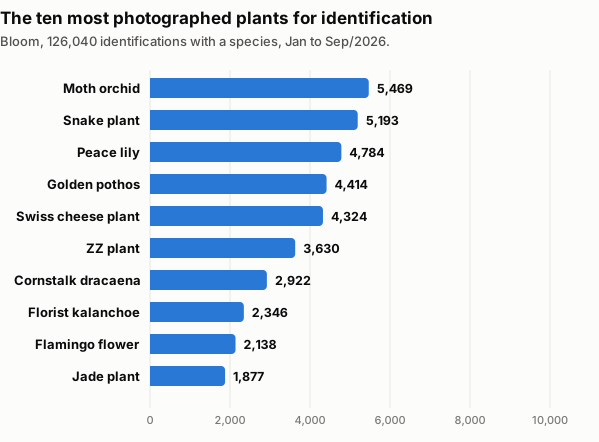
1 | Moth orchid | Phalaenopsis | 5,469 | 4.34% |
2 | Snake plant | Dracaena trifasciata | 5,193 | 4.12% |
3 | Peace lily | Spathiphyllum wallisii | 4,784 | 3.80% |
4 | Golden pothos | Epipremnum aureum | 4,414 | 3.50% |
5 | Swiss cheese plant | Monstera deliciosa | 4,324 | 3.43% |
6 | ZZ plant | Zamioculcas zamiifolia | 3,630 | 2.88% |
7 | Cornstalk dracaena | Dracaena fragrans | 2,922 | 2.32% |
8 | Florist kalanchoe | Kalanchoe blossfeldiana | 2,346 | 1.86% |
9 | Flamingo flower | Anthurium andraeanum | 2,138 | 1.70% |
10 | Jade plant | Crassula ovata | 1,877 | 1.49% |
Source: aggregated Bloom data, 126,040 identifications with an identified species (out of 126,441 that were plants), Jan to Sep/2026. Measure.
The top 15 species represent about 36% of all plant identifications. The remaining percentage is spread across a long tail of diverse species, many of which were only photographed by a few users.
How often people actually water their plants
The University of Maryland Extension advises checking soil moisture before watering, rather than following a rigid calendar. Our data highlights what actually happens when users rely on app reminders.
Interval between two waterings of the same plant | Days |
|---|---|
25% of waterings happen before | 4.4 |
Median | 7.1 |
75% of waterings happen before | 10.2 |
Average | 8.8 |
Source: aggregated Bloom data, 26,976 watering intervals across 8,040 plants, Jan to Sep/2026. Proxy (see methodology).
Comparing each actual interval with the species' specific recommendation, the median delay is just 0.38 days, or roughly nine hours past the target time. In total, 33.1% of waterings occur on or ahead of schedule, while 26.0% are delayed by more than two days.
Here is how the recommended schedule compares to real world user behavior for individual species:
Plant | Recommended | Actual (median) |
|---|---|---|
4 days | 4.7 days | |
Boston fern | 3 days | 3.9 days |
Flamingo flower | 5 days | 5.6 days |
Cornstalk dracaena | 8 days | 8.4 days |
Spider plant | 8 days | 8.6 days |
Golden pothos | 7 days | 8.7 days |
Moth orchid | 7 days | 9.8 days |
Swiss cheese plant | 10 days | 10.1 days |
Florist kalanchoe | 10 days | 10.2 days |
Snake plant | 14 days | 14.5 days |
Source: aggregated Bloom data, species with 100 or more recorded intervals, Jan to Sep/2026. Proxy.
Please note. This data reflects the behavior of users who actively set up reminders in the app, rather than the general population. The metric answers "how often people water when prompted by an app," not "how often they would water on their own." For this reason, it is classified as a Proxy, rather than a direct Measure.
Even though users water nearly on schedule, with less than a day's delay, overwatering remains the most frequent diagnosis. Frequencies are only one piece of the puzzle. Pots without drainage holes, heavy soil, water left in saucers, and using too much water at once do the rest.
Which care tasks users actually complete
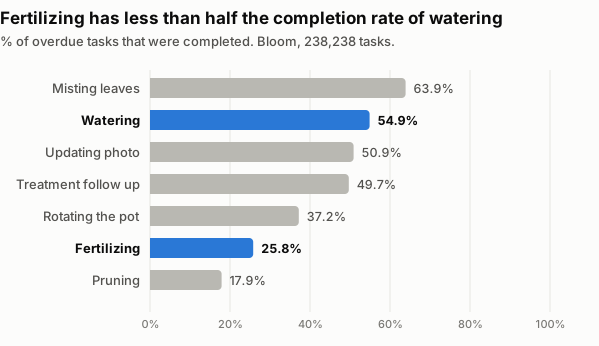
Not all care reminders receive the same level of attention. Looking only at tasks that have passed their due date:
Task | Overdue tasks | Completed | Completion rate |
|---|---|---|---|
Misting leaves | 42,282 | 27,021 | 63.9% |
Watering | 85,441 | 46,932 | 54.9% |
Updating photo | 59,149 | 30,106 | 50.9% |
Treatment follow up | 5,349 | 2,658 | 49.7% |
Rotating the pot | 19,905 | 7,410 | 37.2% |
Fertilizing | 22,625 | 5,835 | 25.8% |
Pruning | 3,487 | 624 | 17.9% |
Source: aggregated Bloom data, 238,238 overdue tasks, Jan to Sep/2026. Measure.
Watering reminders are completed at more than twice the rate of fertilizing tasks. Pruning is the least performed task of all. This is understandable, as pruning requires deciding where to cut, and mistakes feel permanent. Misting leaves leads the list, likely because it is quick, low risk, and satisfying.
The gap between watering and fertilizing has practical consequences. Neglecting fertilizer keeps a plant alive but stalls its growth, as potted soil loses its nutrients within a few months. For a deeper look at this, see our review of watering reminder apps and how they handle broader care routines.
Profile of a typical indoor garden
Metric | Value |
|---|---|
Plants per garden (median) | 1 |
Average plants per garden | 2.8 |
Gardens with only one plant | 53.0% |
Gardens with 10 or more plants | 5.4% |
Outdoor plants | 21.8% |
Pot diameter (median, 7,056 reported) | 17 cm |
Source: aggregated Bloom data, 18,176 gardens and 51,654 plants, Jan to Sep/2026. Measure.
A median of one plant per garden matches the profile of users seeking out the app: someone who recently bought or received a plant, noticed it looking unhealthy, and decided to search for help. The passionate minority with ten or more plants accounts for the vast majority of ongoing care logs.
In terms of overall health, the app generates a health score from 0 to 100 for each photo. Across 61,194 analyzed photos, the average score was 74.6 and the median was 78. Only 11.3% of photos scored below 50, while 45.9% scored 80 or higher.
Industry context and market statistics
Metric | What it is | Source |
|---|---|---|
$79.0 B | spent on lawn and garden retail in the US in 2025, up 13.5% from 2024 | |
$740 | average spending per participating US household in 2025, up 18.3% | |
4.5 million | US households that stopped gardening in 2025 | |
$13.76 B | global indoor plants market size in 2025, projected to reach $21.07 B by 2034 | |
R$ 19.9 B | revenue of the Brazilian ornamental plant and flower supply chain in 2023 | |
69% | of Brazilians enjoy growing plants at home | QuintoAndar and Datafolha Housing Census, 3,186 interviews conducted October 11–21, 2021, margin of error 2% |
In the United States, 4.5 million households stopped gardening activities in 2025, yet overall spending per household grew by 18.3%. Fewer households are participating, but those who stay are spending more. This concentration mirrors our app's user distribution, where the majority of users manage only a single plant.
Market research firms differ widely on the overall size of the global indoor plant industry, with estimates for 2025 ranging from $13.76 B to over $22 B depending on how categories are defined. Rather than presenting an average of these conflicting reports, we cite specific, verified publications.
Frequently asked questions
What is the most common mistake when caring for houseplants?
Overwatering is the single most common error. Out of 24,663 diagnoses on Bloom that received a problem classification between January and September 2026, overwatering was identified in 35.76% of cases, whereas acute and chronic underwatering combined accounted for 18.71%. Together, watering issues explain 54.5% of all indoor plant health problems.
How many times a week should I water my houseplant?
There is no single correct answer, and trying to follow a calendar is why many plants are overwatered. The University of Maryland Extension recommends checking soil moisture before watering. In practice, the median interval between waterings is 7.1 days, though this ranges from 4 days for Boston ferns to 14.5 days for snake plants.
Which houseplant is the hardest to kill?
Among indoor foliage plants, the snake plant has the best defense against the most common mistake: only 32.3% of its diagnosed issues are due to overwatering, the lowest rate among foliage plants with a significant sample size in our database. The ZZ plant, despite its reputation, sits at the opposite end of the spectrum at 71.1%.
What are the most popular houseplants?
Based on 126,040 identifications on Bloom where the species was recognised, the five most frequently photographed plants are the moth orchid (4.34%), snake plant (4.12%), peace lily (3.80%), golden pothos (3.50%), and Swiss cheese plant (3.43%). The top fifteen species account for approximately 36% of all identifications.
Methodology
Data collection. Proprietary data is retrieved from aggregated queries of the Bloom application database, utilizing counts, averages, and group medians. No query retrieves individual records, user identifiers, or personal data. Individual entries were not accessed for this study.
Reporting period. January 20 to September 23, 2026, capturing the period from our first recorded database entries to the date of this update. Because our user base grew continuously throughout this window, absolute volume totals are not comparable month over month, though percentage distributions remain highly reliable.
Sample thresholds. To protect data reliability, no proprietary metrics are reported for groups with fewer than 20 cases. For species specific tables, the minimum threshold is set to 100 cases.
Denominators. The percentages in the diagnosis table are calculated based on the 24,663 diagnoses that received a disease classification, rather than the 25,875 total diagnoses: 1,212 were recorded without any classification. Likewise, the species distribution is calculated based on the 126,040 identifications with an identified species, rather than the 126,441 that were plants.
Botanical names. When the catalog stores the same plant under two names, such as Sansevieria trifasciata and Dracaena trifasciata, or a species and its cultivars, such as 'Neon' and 'Manjula' pothos, the counts are combined under the accepted name.
Data labeling. All internal metrics are classified as either a Measure (direct count of database events) or a Proxy (an observed behavior that closely approximates the target metric). Our watering frequency data is a Proxy because it measures the habits of users who actively receive app reminders.
Watering interval calculations. Calculated as the time elapsed between two consecutive watering confirmations for the same plant. To eliminate anomalous data points, intervals shorter than 12 hours or longer than 120 days were excluded, leaving 26,976 intervals across 8,040 plants.
Limitations. We do not track plant mortality rates directly, as we lack a reliable, objective way to confirm when a plant is discarded. Our geographic and linguistic distributions reflect our user base rather than global populations. Finally, health diagnoses are determined via photo analysis with a mean confidence level of 0.784, meaning they are highly accurate but not infallible.
Citation policy. You are welcome to use, share, or publish any statistic found on this page, provided you attribute the data to Bloom with a link to this page. If you require custom metrics or historical data for a specific species, feel free to contact us.
Update history.
September 24, 2026: numbers updated with the database up to September 23. Overwatering went from 39.3% to 35.8% of classified diagnoses and the ZZ plant from 80.3% to 71.1%, with both remaining in first place. The table by species expanded from 15 to 25 plants as more species reached 100 diagnoses. Duplicate botanical names are now combined. The "largest garden in database" row was removed because it described a single user.
September 1, 2026: first version.
Updated September 24, 2026. The next scheduled update will be published in October.
Related articles
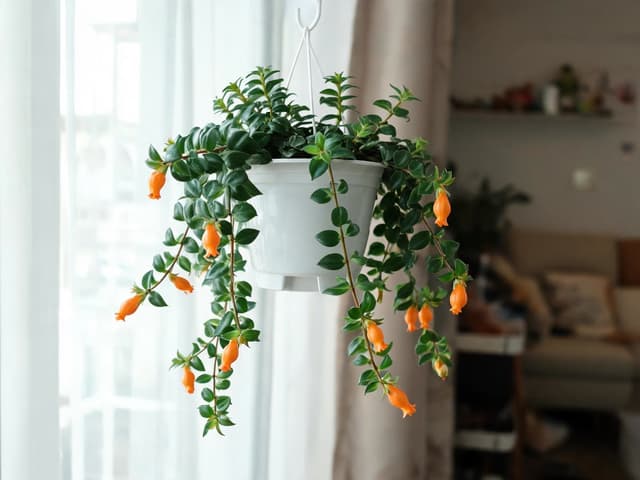
How to Care for a Goldfish Plant: Light, Watering, and Blooms
How to care for a goldfish plant: bright light without strong sun, water when the soil surface dries, and humid air. Learn how to tell a Nematanthus from a Columnea, why it drops leaves, and how to get it to bloom again.
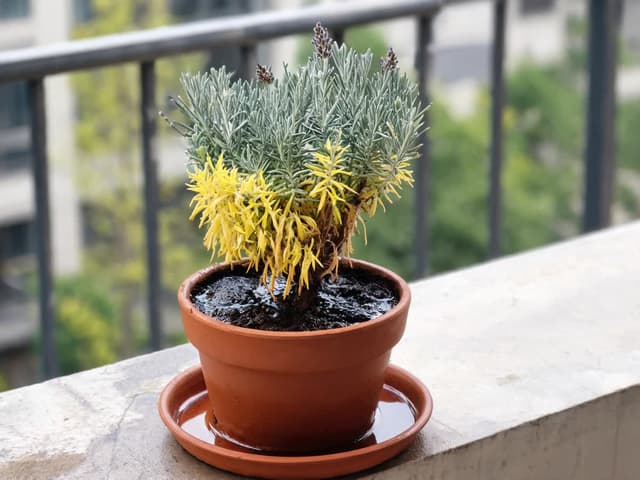
Lavender Leaves Turning Yellow: Where the Yellowing Starts Shows the Cause
Lower leaves turning yellow with moist soil means overwatered roots, the most common cause. Old leaves drying one by one on woody stems is normal. Take the stem and root test, see if your plant can still be saved, and find out what to do today.
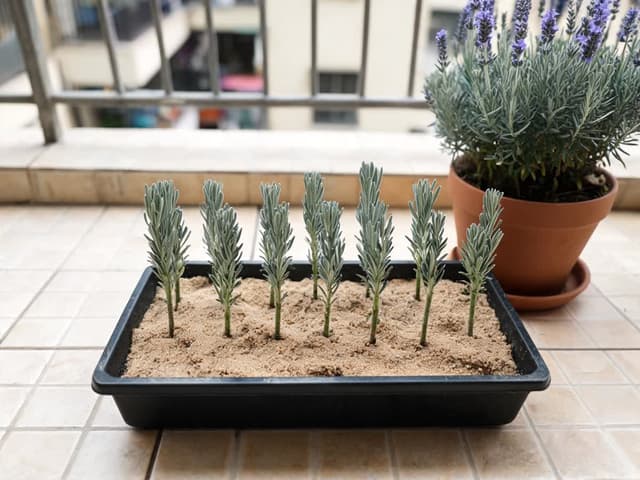
How to Propagate Lavender: Where to Cut and Why Cuttings Rot
A lavender cutting comes from a non-flowering branch tip, about 4 inches long, planted in sandy soil that never stays soggy. Learn where to cut, rooting times, seasonality in Brazil, and what to do if the base turns black.